
Over the past year, I have been deployed Crowdstrike Falcon LogScale (LogScale) as a Security Incident and Event Management (SIEM) platform. This included ingesting a diverse range of log sources, building dashboards and authoring detection rules. In this post, I aim to share the key insights I’ve gained for those considering deploying LogScale or evaluating its efficacy as a SIEM, even with the imminent launch of the Next-Gen SIEM within the Falcon platform.
Crowdstrike Falcon LogScale, formerly known as Humio, is a highly-performant observability platform that excels due to its index-free database technology. This allows it to ingest, store, and search vast amounts of log data with exceptional speed. LogScale uses its own query language, called Crowdstrike Query Language (CQL) which is well-designed and easy to learn. For those familiar with Splunk or the Elastic Stack, LogScale might appear somewhat basic and lacking in several features typical of modern SIEMs. However, what it lacks in features it makes up for in speed and compatibility.
In our comparative tests, LogScale demonstrated its efficiency by outperforming Splunk by a factor of 11x in terms of search speed. This was observed while querying identical telemetry data from Crowdstrike over the same timeframe using a query translated from SPL2 to CQL. Moreover, we were able search through petabytes of firewall logs accumulated over the past year in just seconds.
Ingest Everything
LogScale has few limitations when it comes to ingesting data and supports structured and unstructured data from a number of ingest methods. From its native log shipper Falcon Log Collector (FLC) to third-party log shippers, such as Splunk’s HTTP Event Collector, Elastic Beats, Cribl Crowdstream, Logstash, rsyslog, Vector and sending log data direct to the ingest API. This the only real limit on what you can ingest is the amount of data you are licensed for.
When adding a new data source, always check the LogScale Marketplace for packages first, as they typically include recommended ingestion methods. Additionally, visit CrowdStrike’s LogScale community content on GitHub for scripts and other resources for common log sources. If you cannot find the log source in either of these, installing FLC directly on the server where the application runs is the way to go, configuring it to read data directly from the log files. I also use the ‘cmd’ type to execute code to retrieve the latest logs from an API for a number of cloud-based SaaS platforms.
Create a View for Security in LogScale
In LogScale, event data is organised into buckets known as ‘Repositories’, which can contain logs from either a single source or multiple sources across various types. Beyond simply storing logs, each Repository can be equipped with packages containing parsers, dashboards, queries and detection rules. To facilitate broader data analysis, LogScale then also has ‘Views’ which are an abstraction layer that doesn’t store data but rather aggregates it from multiple Repositories. This centralisation of log sources supports the construction of advanced queries that joins data from different log sources, thereby enhancing the detection and analysis of potential security threats throughout the network.
For effective security management, teams should utilise Views that bring together all of their critical log source Repositories. By aggregating logs from key components such as the Falcon Data Replicator (FDR), firewalls, Linux and Windows servers, Windows endpoints, cloud workloads, email protection services, SSO providers, SASE and CASB within a single View, security teams can significantly streamline the search for indicators of compromise.
Create the Dashboards that the Falcon Platform is Missing
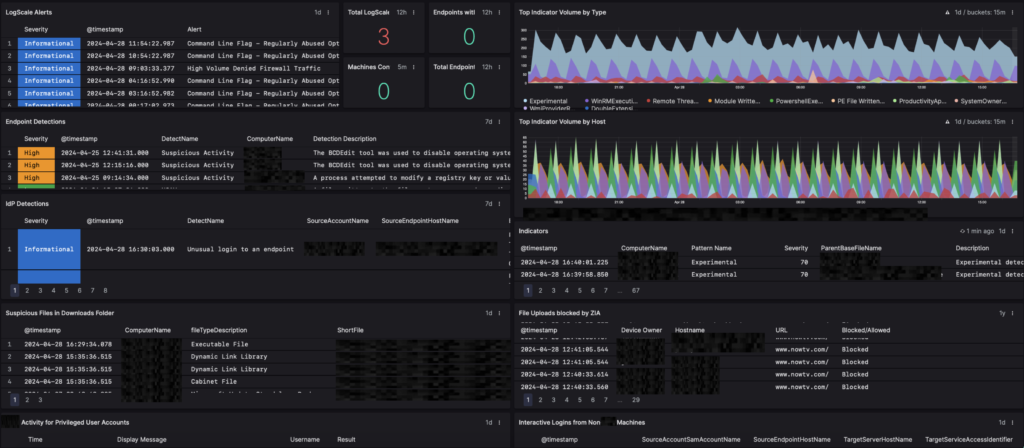
If you’re using LogScale, it’s likely you’re also a Crowdstrike Falcon Insight XDR customer and utilising Falcon Data Replicator (FDR) of Falcon Long Term Repository (FLTR) to ingest that rich telemetry into LogScale. Many may also use Crowdstrike Identity Protection, feeding that into LogScale as well. This setup makes LogScale an ideal platform for creating a consolidated view of Endpoint, Identity, CPSM and DLP detections from Crowdstrike. I recommend developing a comprehensive Security Dashboard that aggregates all detections onto a single screen. This arrangement is particularly effective for display on wall monitors and video walls within a Security Operations Centre (SOC), facilitating real-time threat monitoring and coordinated incident response.
Create the Alerts that the Falcon Platform is Missing
One of the most important parts of any SIEM is the ability to create detection rules. Detection rules in LogScale are called ‘Alerts’ and should function to notify analysts of any suspicious activity. The most effective way to figure out what detection rules you need to write is to assess the existing detection capabilities of your security tools and then overlay your threat model on top of this. Where there is an area that is covered by your threat model but a rule does not exist, write a rule. For instance, if your threat model includes concerns about threat actors targeting system administrators by compromising their identities by modifying their accounts, and your SSO provider lacks built-in alerts for changes to an administrator’s account, you should write a custom detection rule that triggers when an administrator’s account is modified.
When setting up Alerts, prioritise creating rules for actions that should absolutely not occur under normal circumstances and unequivocally indicate malicious intent. Once you have these in place you can then start to create rules for activity that is suspicious but infrequent. The key to writing good Alerts is to make an Alert as specific as possible. I would rather have a large number of specific queries than a query that is too general and generates false positives. For example, if a query generates false positives because it cannot account for the variance in logs from different linux distributions write a separate query to detect the activity on each different linux distribution. When writing your Alerts you must also back test them as far back as you can go and add remove any false positives with exclusions using the not operator (!=).
Use Files to write better Alerts and Widget Search Queries
To add context to your search queries without making them too long to read and understand you can use the match() function to perform a lookup against data held in a File. match() matches a value in a CSV file or JSON data that you upload, the data can be globbed to look for data within strings making it incredibly versatile. My favourite use of the match() function is to add organisational data that changes relatively infrequently but is impractical to write in the body of a query, such as a list of system administrators.
Shown below is a search query used for a Widget to display the activity of Okta Administrators in a table to be used on a dashboard.
#type=okta-sso
| Vendor.eventType=*
| regex("^(?<username>[^@]+)@", field=Vendor.target[0].alternateId)
| match(file="administrators.csv", column=SAMaccountName, field=username, strict=true, glob=true)
| rename(field=Vendor.displayMessage, as="Display Message")
| rename(field=username, as="Username")
| rename(field="Vendor.outcome.result", as=Result)
| select([@timestamp, "Display Message", "Username", Result])